The Facebook Ads Account report affords you insights into your Facebook ad performance for all of your campaigns across a specific date range. Breaking down Facebook ad performance within a specific date range, the report presents a look at your ad impressions, reach, clicks, cost per click, ad spend, and more.
The data shown within the report is segmented according to month. However, should the date range selected reflect partial periods within a month or multiple months, the report will still segment your data according to month, showing your ad performance for the partial monthly period(s) selected based on the start date chosen.
Important! In order to view this report, you must authorize a connection to a Facebook account that has Admin permissions for a Facebook Page and connect your Facebook ad account.
Facebook limits the amount of data available via their API to 90 days. We follow Facebook's best practices in order to provide the reporting that they allow. We review third-party developer API changes monthly, so if they change the rules to allow for a longer reporting period, we'll update our reports accordingly.
- SEO
- Rank Tracker
- Local SEO
- Mobile SEO
- Link Manager
- Landing Pages
- Social Signals
- On-Page Optimization
- Enterprise SEO Solutions
- Marketing
- Competition Analysis
- Insight Graph
- Keyword Research
- Graphs & Widgets
- Market Reach
- Marketing KPI
- Brand Visibility
- White Label SEO
- Marketing Dashboard
- Client Dashboard
- PDF Reports
- PDF Templates
- Other
- Email Notifications
- Portfolio Management
- Integrations
- Google Analytics
- Search Console
- Pay Per Click
- WeDevelop
- API
Facebook Account Ads Performance
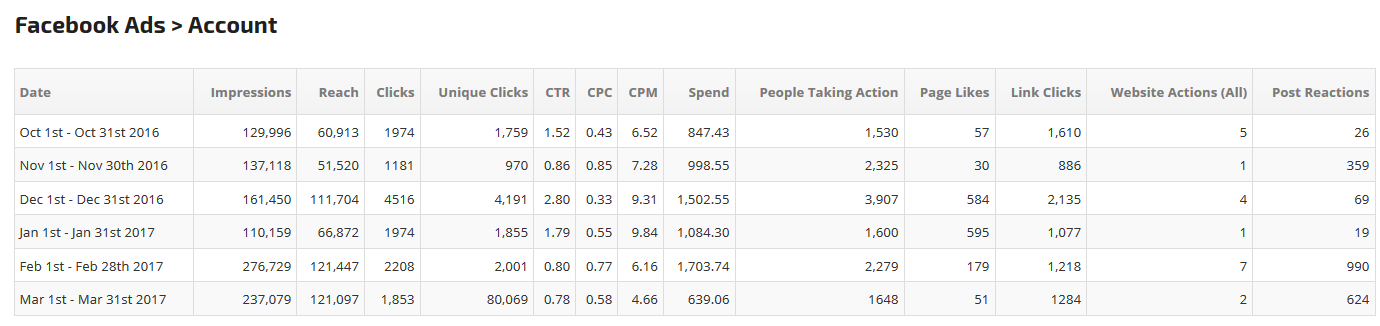
The Facebook Ads Account report presents you with a comprehensive lists of metrics with which to measure your Facebook ad performance. The metrics indicated are shown on a table that displays total numeric values as well as averages/ratios when relevant (i.e. CTR, CPC, and CPM).
 The following Facebook metrics are included within the report:
- Impressions: Indicates the number of times your ads have been viewed regardless of repeat views by the same user.
- Reach: The number of unique users who have viewed your ads.
- Clicks: The total number of times users have clicked on your ads.
- Unique Clicks: The number of unique users who have clicked on your ads.
- CTR (Click-through Rate): The ratio of users who have clicked on your ads relative to the total users who have viewed them.
- CPC (Cost per Click): The average cost to you for every click on your ads.
- CPM (Cost per Thousand Impressions): The average cost to run your ads for 1,000 impressions.
- Spend: The total spent on your ads within each date range.
- People Taking Action: The number of unique users who have taken any form of action (i.e. liking your page, commenting, etc.) in connection to your ads.
- Page Likes: The total number of likes to your Facebook page that can be ascribed to your ads.
- Link Clicks: The number of clicks on the links in the ads.
- Landing Page Views: The number of times the user loads a webpage after clicking an ad
- Website Actions (All): The number of actions tracked by the Facebook Pixel placed on your website as ascribed to your Facebook ads.
- Post Reactions: The total number of reactions (Like, Love, Haha, Sad, and Angry) received by your ads.
- Total ROAS: Measures the revenue generated compared to the money spent on the advertising account based broken into months from the date range selected.
Facebook Ads Reports & Graphs
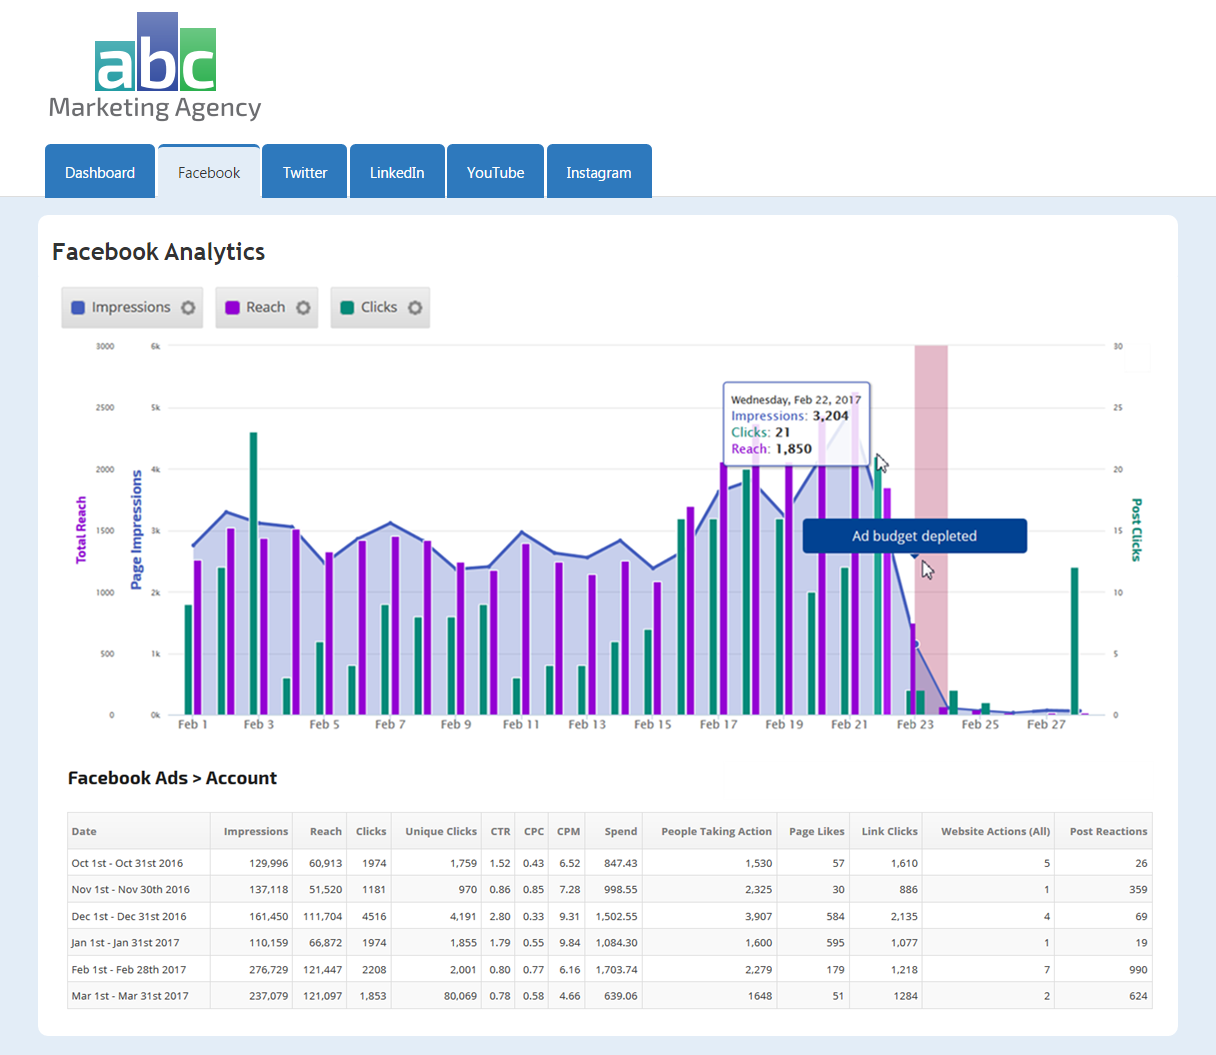
A white label marketing dashboard can be used to showcase Facebook Ads performance. In this example, an Insight Graph has been utilized to display Impressions, Clicks, and Reach. The Ads Account metrics table below displays all of the available metrics, however, you may choose to highlight specific metrics and hide others.
A white label marketing dashboard can be used to showcase Facebook Ads performance. In this example, an Insight Graph has been utilized to display Impressions, Clicks, and Reach. The Ads Account metrics table below displays all of the available metrics, however, you may choose to highlight specific metrics and hide others.
 |
Report Dates
|
 |
General Settings
|
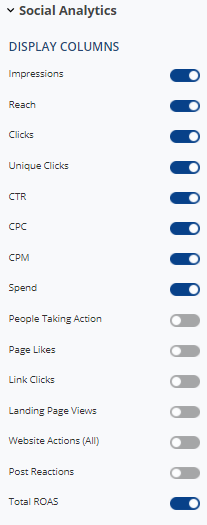 |
Social Analytics - Display Columns
|
 |
Select Facebook Ads Campaings to display |
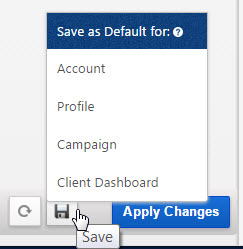 |
Save
|
Facebook Ads Custom Graphs & Widgets
Facebook Ads performance data can be displayed in Insight Graphs and Metric Widgets and shared in white label Marketing Dashboards, Client Dashboards, and scheduled PDF Reports.
If you aren't familiar with building custom graphs, please refer to the following documentation to learn more about the variety of customization options.
Graph Settings
In both the Insight Graph and Metric Widgets:
Repeat for each individual metric that you want included on the graph.
This is an example of Account Mode
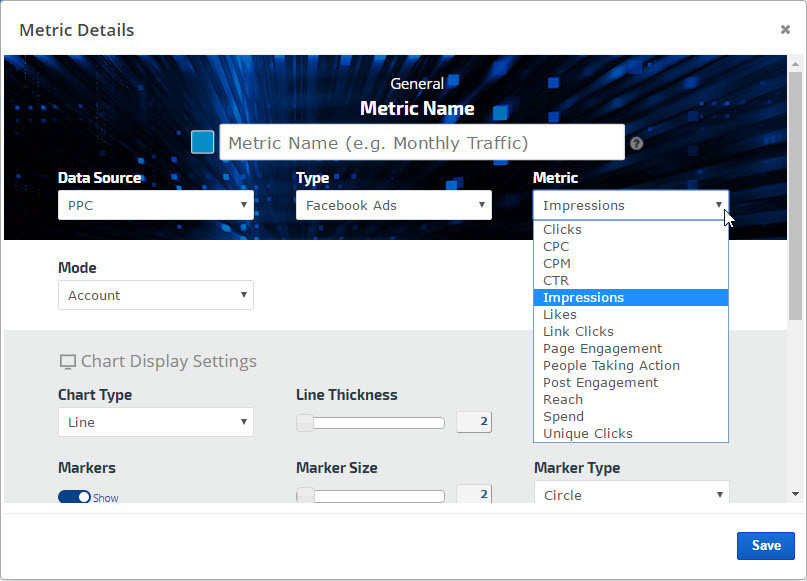
In both the Insight Graph and Metric Widgets:
- Enter a Metric Name for display in the graph
- Data Source: PPC or Social Analytics (the data is available in both categories)
- Type: Facebook Ads
- Metric: Clicks, CPC, CPM, CTR, Impressions, Likes, Link Clicks, Page Engagement, People Taking Action, Post Engagement, Reach, Spend, or Unique Clicks
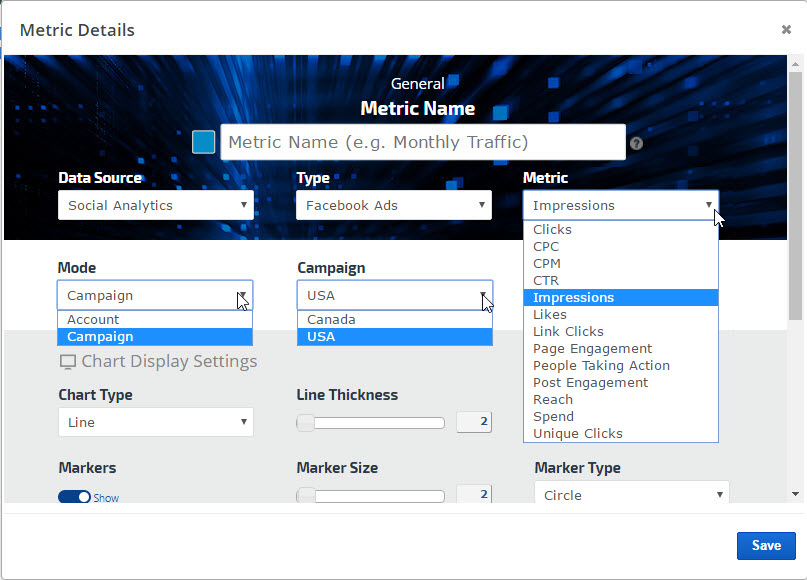
- Mode: Account or Campaign. If Campaign is selected, then also select the Campaign name in the next field
Repeat for each individual metric that you want included on the graph.
This is an example of Account Mode
Example of Campaign Mode
If you aren't familiar with building custom graphs, please refer to the following documentation to learn more about the variety of customization options.
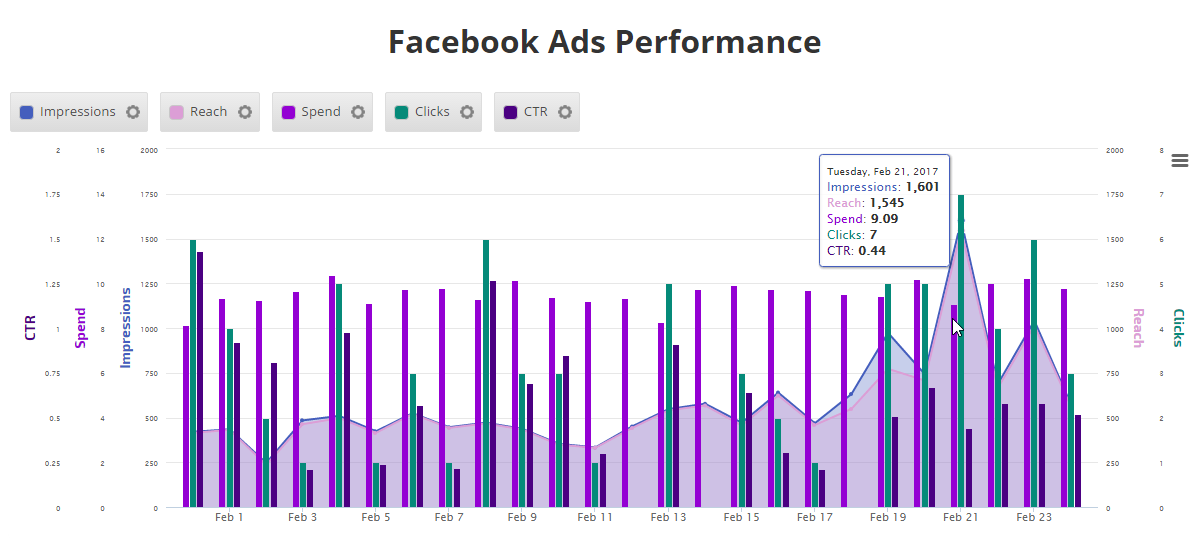
Facebook Ads Insight Graph
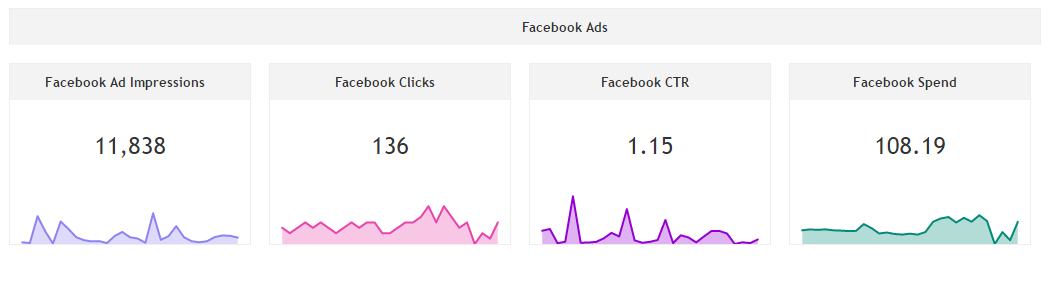
Facebook Ads Performance Widgets
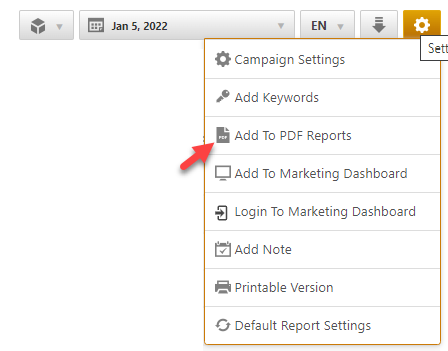
Add to PDF Report
Conveniently add a report or graph with its current settings to a PDF report by hovering over the gold gear icon and selecting Add to PDF Reports
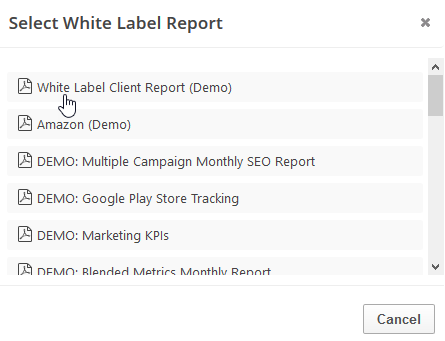
Select the PDF Report that you want the report or graph added to
Drag the new report or graph into the position you want it to display in the PDF and confirm that the Date settings do not conflict with the automated scheduling settings.
Add to Marketing Dashboard
Conveniently add a report or graph with its current settings to a marketing dashboard:
1. Hover over the gold gear icon and select Add to Marketing Dashboard
2. Select the Dashboard (campaign name)
3. Select the Dashboard Page that you want the report added to

1. Hover over the gold gear icon and select Add to Marketing Dashboard
2. Select the Dashboard (campaign name)
3. Select the Dashboard Page that you want the report added to
4. Click the "Go to Dashboard" link to further customize the report (e.g., drag it to a specific position on the page, change date settings, etc.)

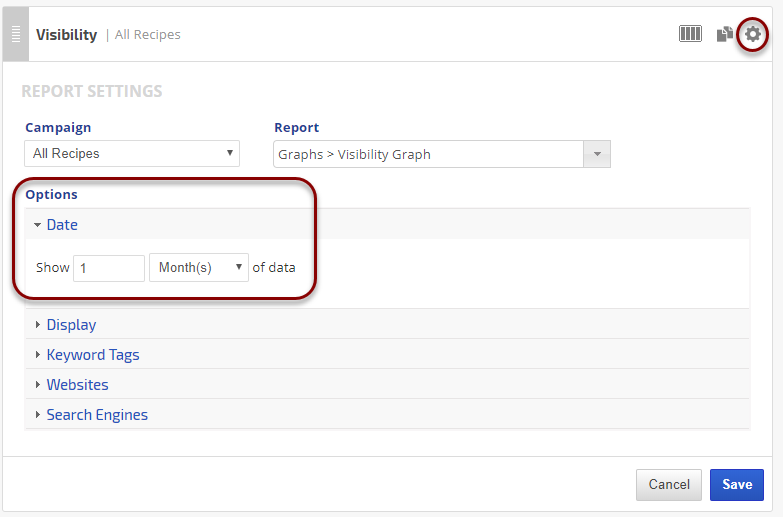
Refer to the Report Options section for details regarding the display settings, filters and sort options available for this report.
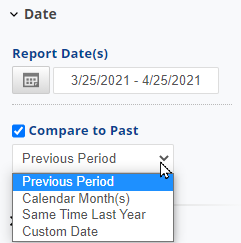
The report date (or date range) is governed by the selected Dashboard date option: Date Selection or Fixed Periods, learn more...
- Daily reports default to the last day of the selected period
- Weekly and monthly reports default to 1 month of data